Trello, a helpful project management tool, has been making things easy through its features for organization and collaboration of projects. For advanced reporting, it is brilliant news for users that Power-Ups are made available for necessary features such as Trello reporting.
To maintain being user-friendly, Trello has focused on its common attributes, resulting in some features being less prioritized. These features include creating reports which are vital in visualization and analysis of the current status and trends of projects.

A. Butler on Trello
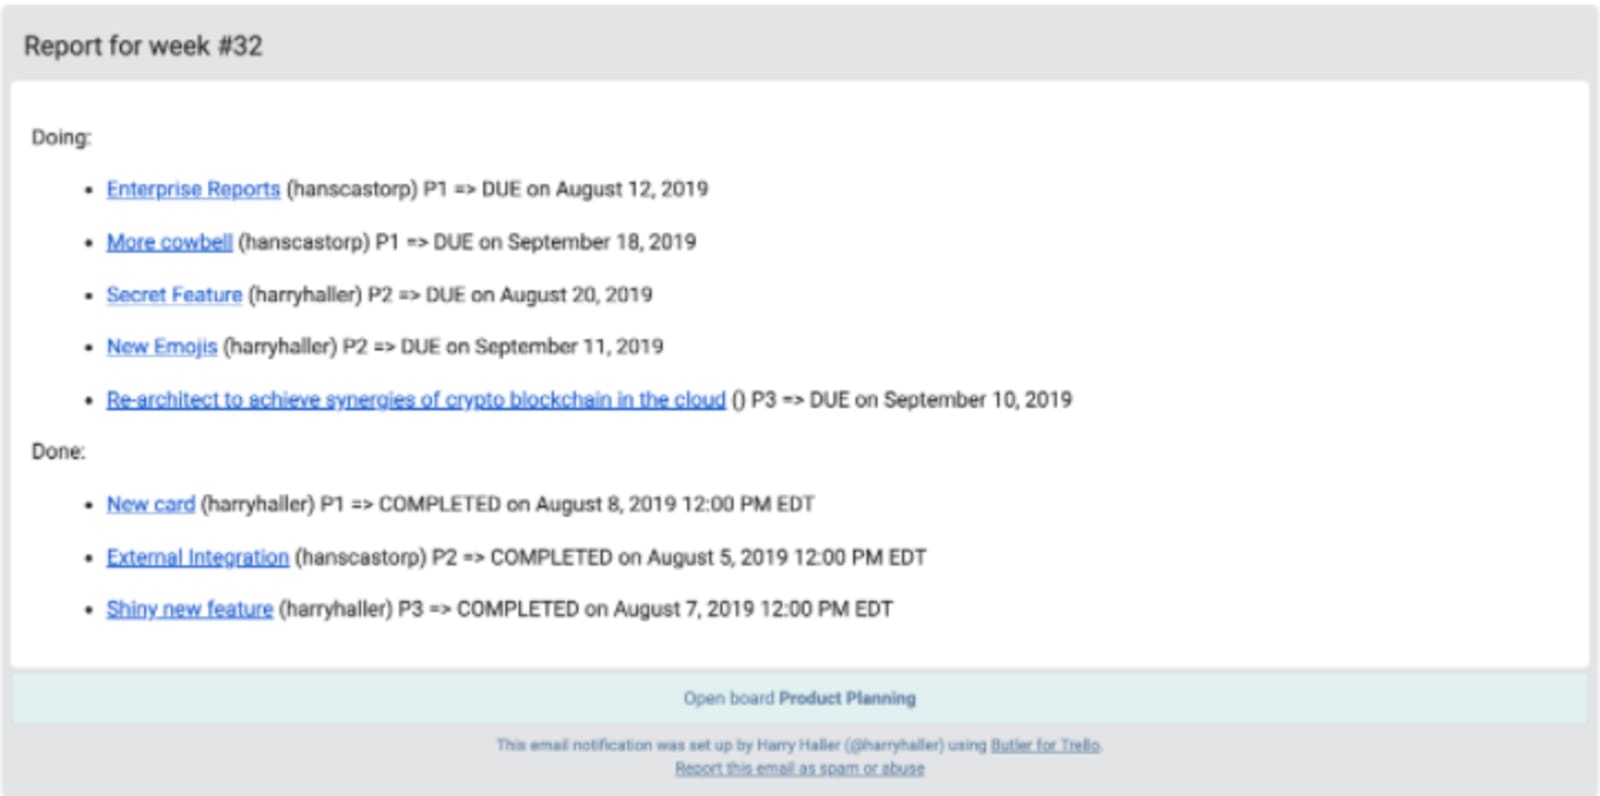
Butler on Trello is one method in creating reports by collecting several cards from the boards. Its default format is a list of card names connected with the cards. Users can customize reports by choosing the “using pattern” option by clicking on the pencil icon. The content of the current card replaces the variables. The patterns will reflect on each of the cards. One command can generate multiple reports, and the variables can be named and used together. There are, however, some excluded variables in using this Butler feature. Applications are now commonly used with Trello to create reports.
B. Applications for Trello reporting
1. Placker
Placker is commonly utilized for project management, Scrum and agile software development, overseeing events and backlog, and creation of dashboards to monitor work progress. Card mirroring with Placker is helpful for tasks that commonly need collaboration between teams.
Placker for Trello reporting is conveniently used either through the Gantt chart, Bar charts, or Trend charts. It will depend on the type of report the users want to create from Trello boards. Trello reports are made and exported to either a PNG/ PDF file or a spreadsheet.
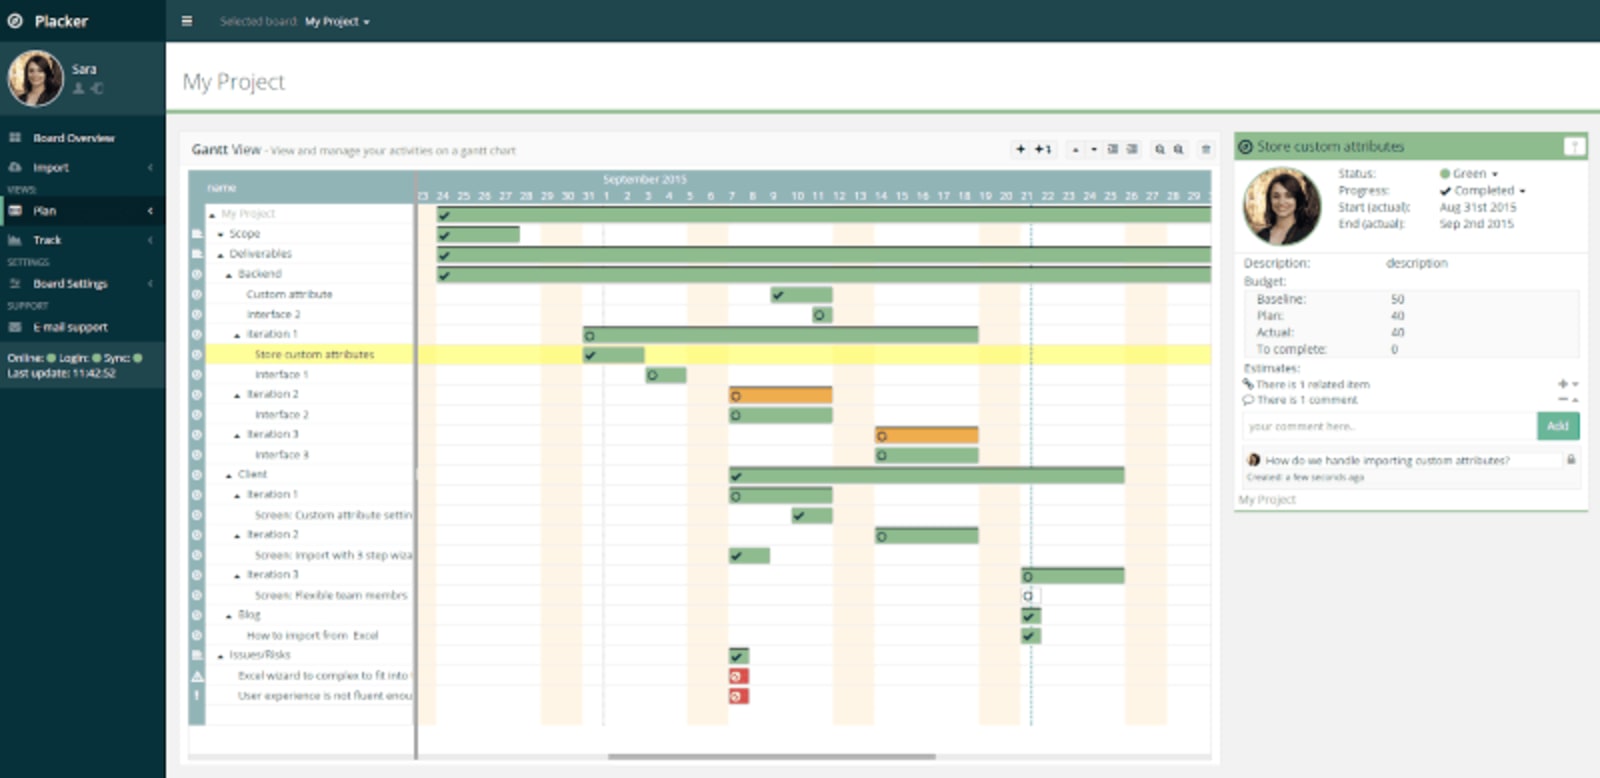
a. Gantt charts
This feature accessible from Placker for Trello reporting provides a flexible view of data in terms of layout, order, and zoom level. One or multiple boards can be viewed in a single Gantt chart, plotting data by comparing dates and projecting progress. Use filters to create an optimal display of data. Users can create dependencies between cards to schedule them automatically.
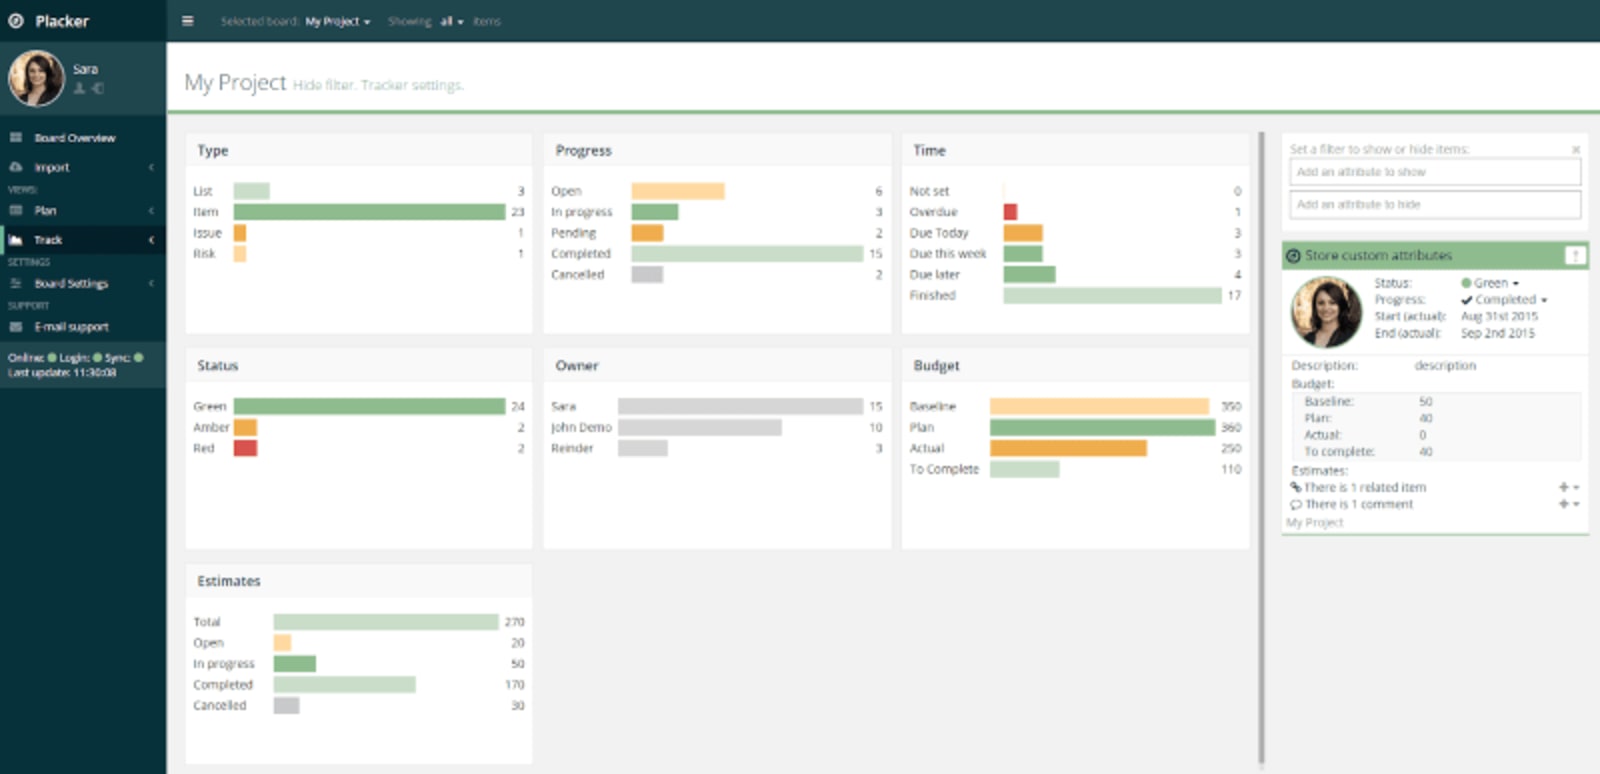
b. Bar charts
Cards collated with attributes using bar charts, allowing visualization of a current project’s status. Default attributes generated into bar charts by Placker for Trello reporting are Owner, Timeliness, and Progress. However, users of this feature can customize the attributes created in the report.
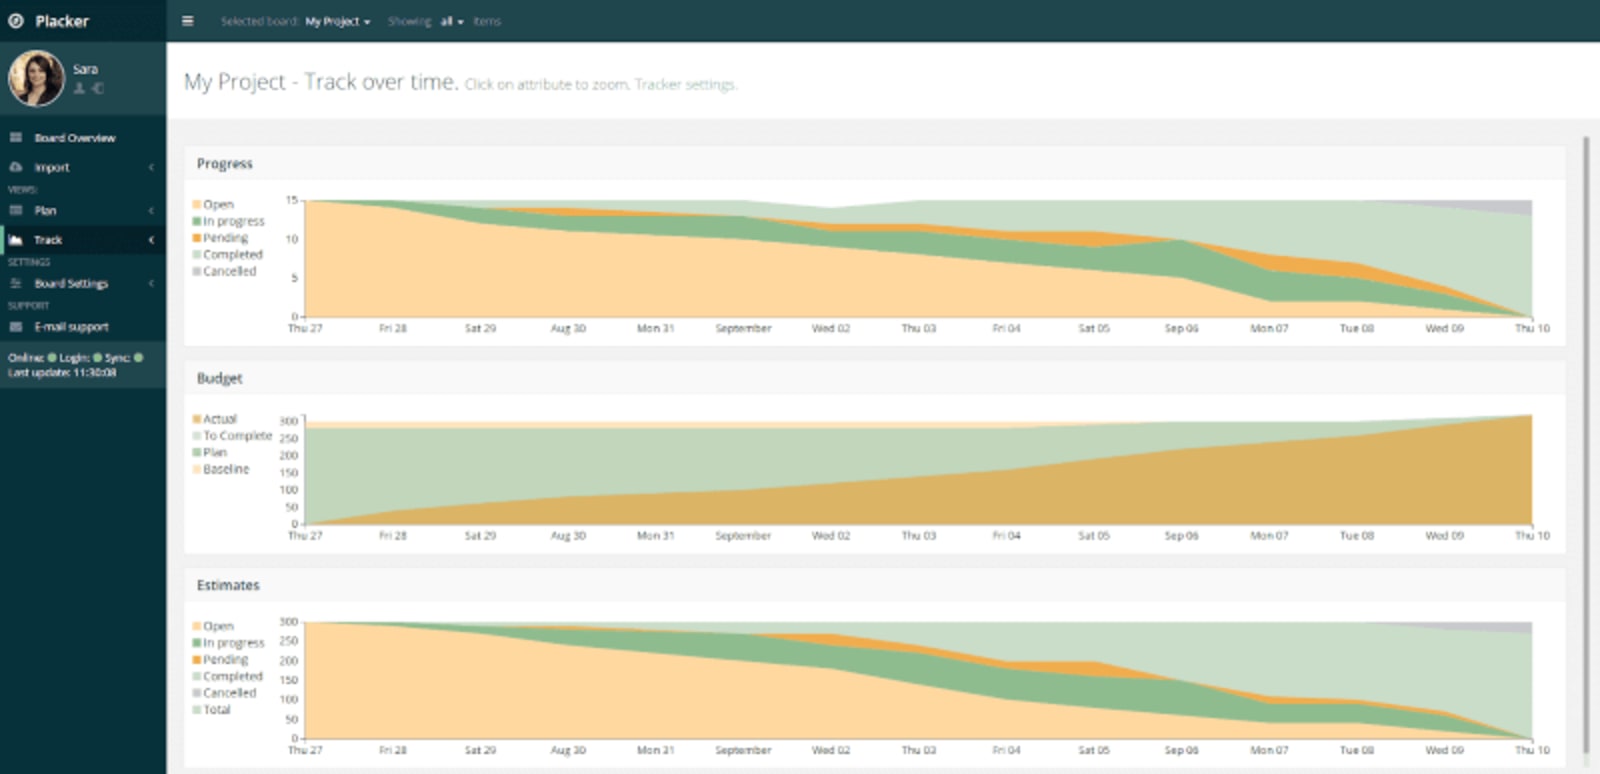
c. Trend charts
Data is plotted versus time, allowing visualization on the status of a project. Many users utilize this feature to have a clear and complete understanding of the progress of the cards.
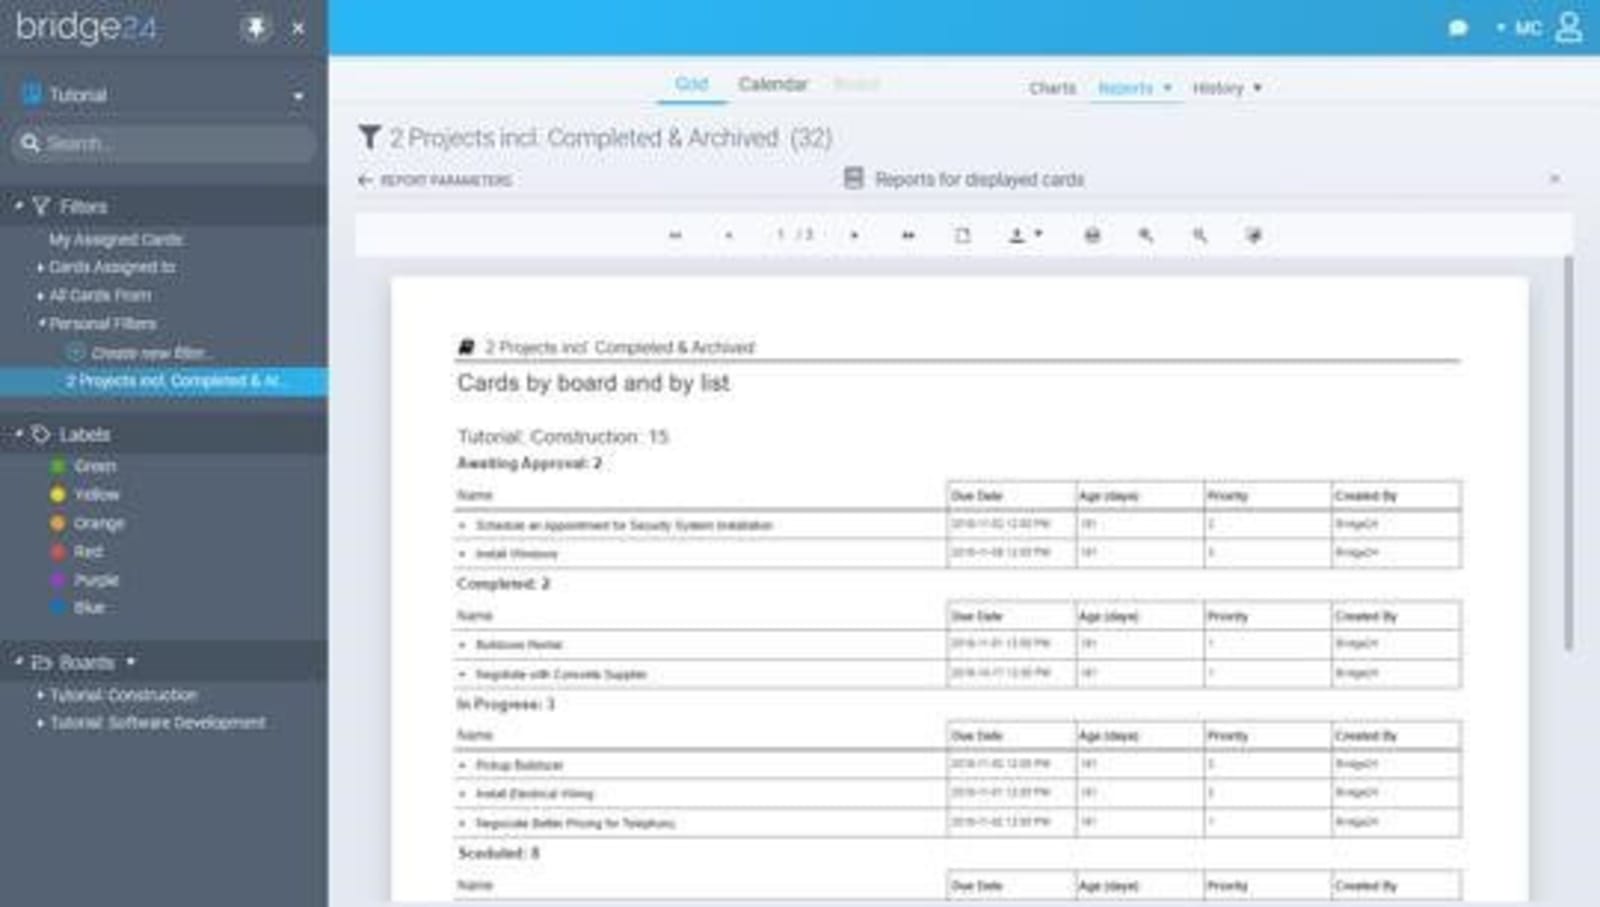
2. Bridge24 for Trello
Bridge24 fills the reporting gap for Trello by providing a connection between the two applications and syncs up-to-date data. This app also provides a flexible view of data by the use of other features such as Grid view, Calendar view, and Kanban Board mode. Advanced reports created using Bridge24 improves efficiency in project management. It includes a 2-level grouping with unlimited columns.
These reports are created from chosen predefined ones and viewed in a printable format. PDF, CSV formats, and spreadsheets are the most commonly used export formats in generating these reports.
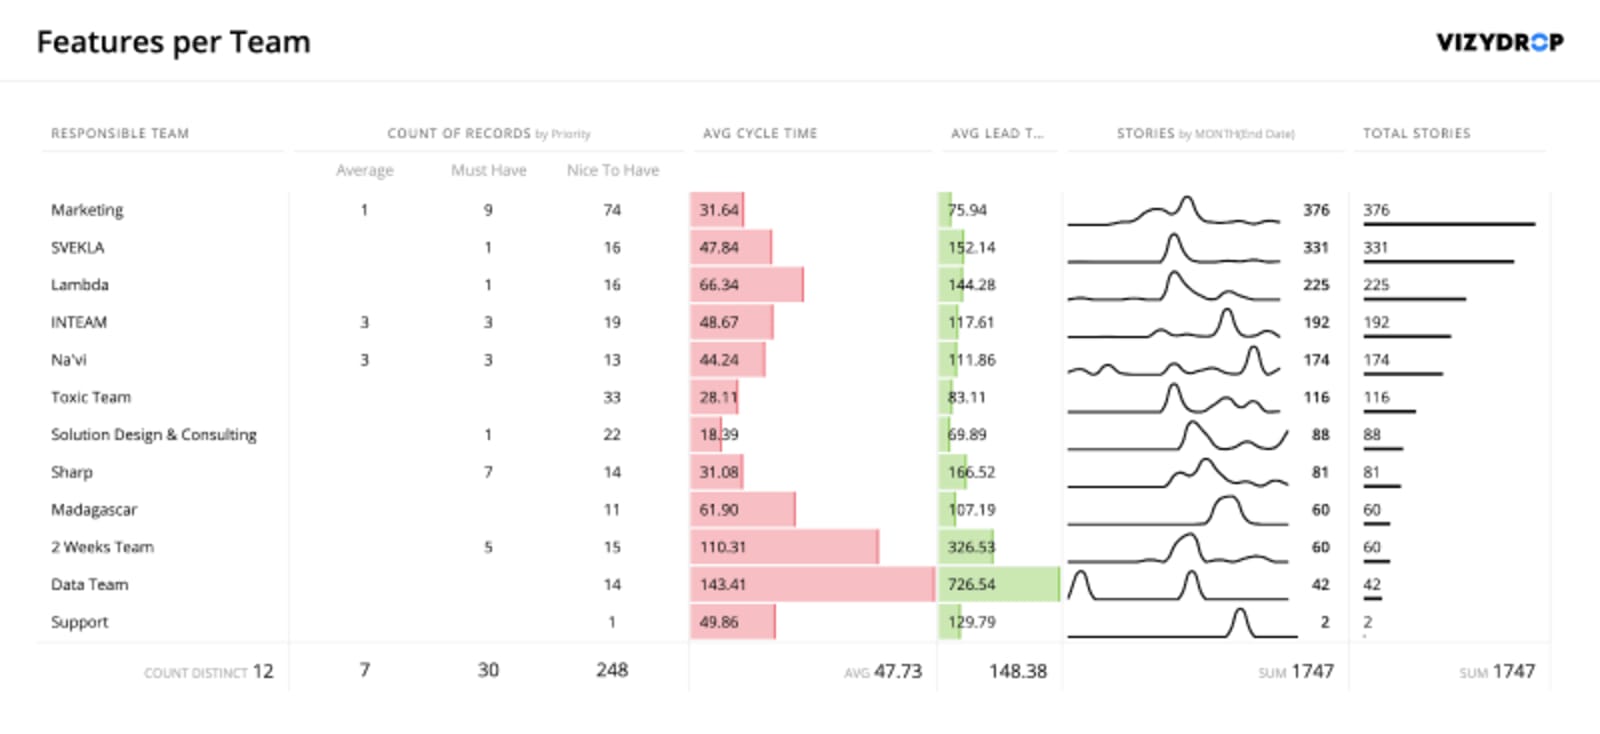
3. Charts by Vizydrop
Vizydrop is an intelligence platform that provides users with a user-friendly method to explore data through the Charts for Trello feature. Users can choose predefined templates from a gallery provided, including charts that prevent them from starting from scratch in making their reports. They have the option to modify the existing charts or to have a visualization of data using the chart editor, providing them with an easy way to explore data.
Charts by Vizydrop enhances workflow analysis by displaying key metrics from data of boards, conveniently creating reports, and making comparisons of data from multiple Trello boards. Users can print the created reports or export them into PNG, CSV, or JSON format.
4. Corello
Compared to the other apps for Trello reporting, Corello is simpler to use, efficient and readable. This app provides customization options to choose from as one of its features, allowing users to opt for the metric they are interested in viewing.
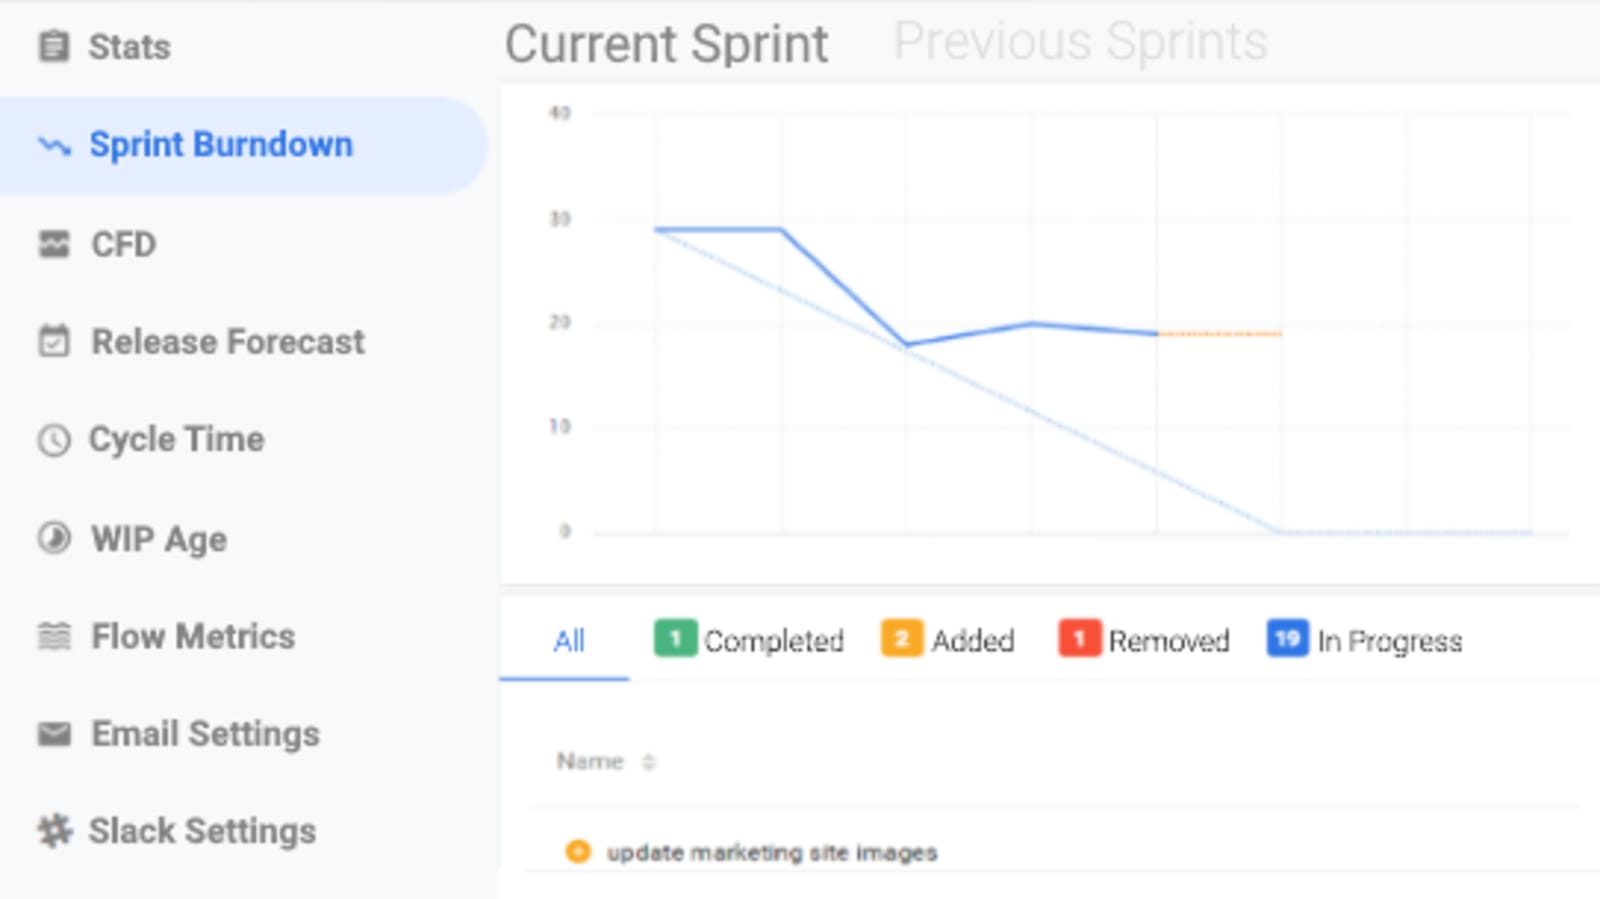
A power-up for Trello provided by Corello is the Agile Tool that provides users with options to add story points and WIP limits. This power-up tool integrates with Scrum and Kanban charts, CFDs, burndowns, and cycle time charts.
a. Story points for Trello
Story points estimate work by breaking links between the duration to complete a task and the number on the estimation. These make it easier for users to discuss estimates.
Using the Story points for Trello feature allows simplified setting and viewing of story points on cards. The story points are shown on the front and set on the back. Users have the option to either enter their value or to use the Fibonacci number as default for their estimates.
The color scale for the points on cards allow easy visualization of which cards have the higher or lower estimates. Unestimated cards are highlighted in red to be easily spotted.
b. WIP limits
Setting WIP limits encourages users to direct their attention to finishing work before starting on new ones. Use of the WIP limits can be for individual lists using the Agile Tools. The number of cards and WIP limits shows on the front of each card. In cases when a user reached the limit for WIP, the cards are being highlighted.
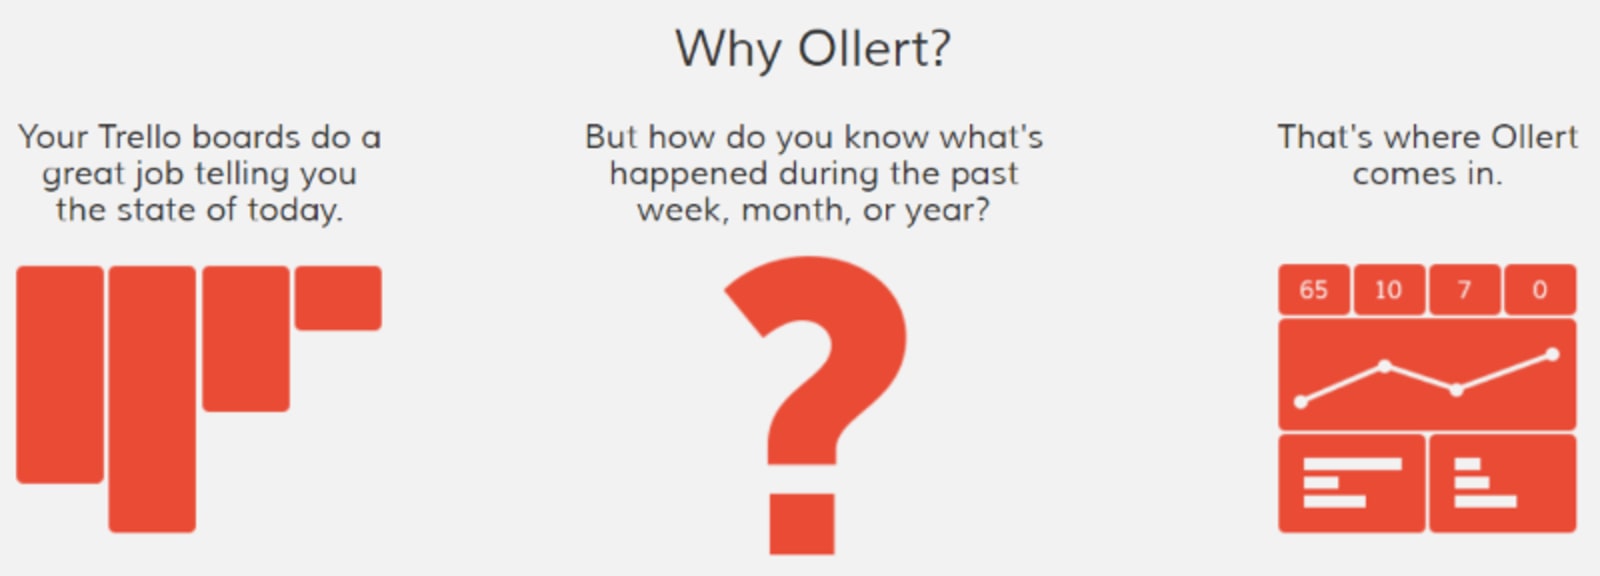
5. Ollert
This application allows users to monitor their work in progress using WIP charts. Users utilize label charts to view the commonly used labels by users in a team. Users of Ollert can view their Cumulative Flow Diagrams that provide analysis of workflows, helping in identifying problems encountered on a project. These are the usual methods to stabilize the workflows.
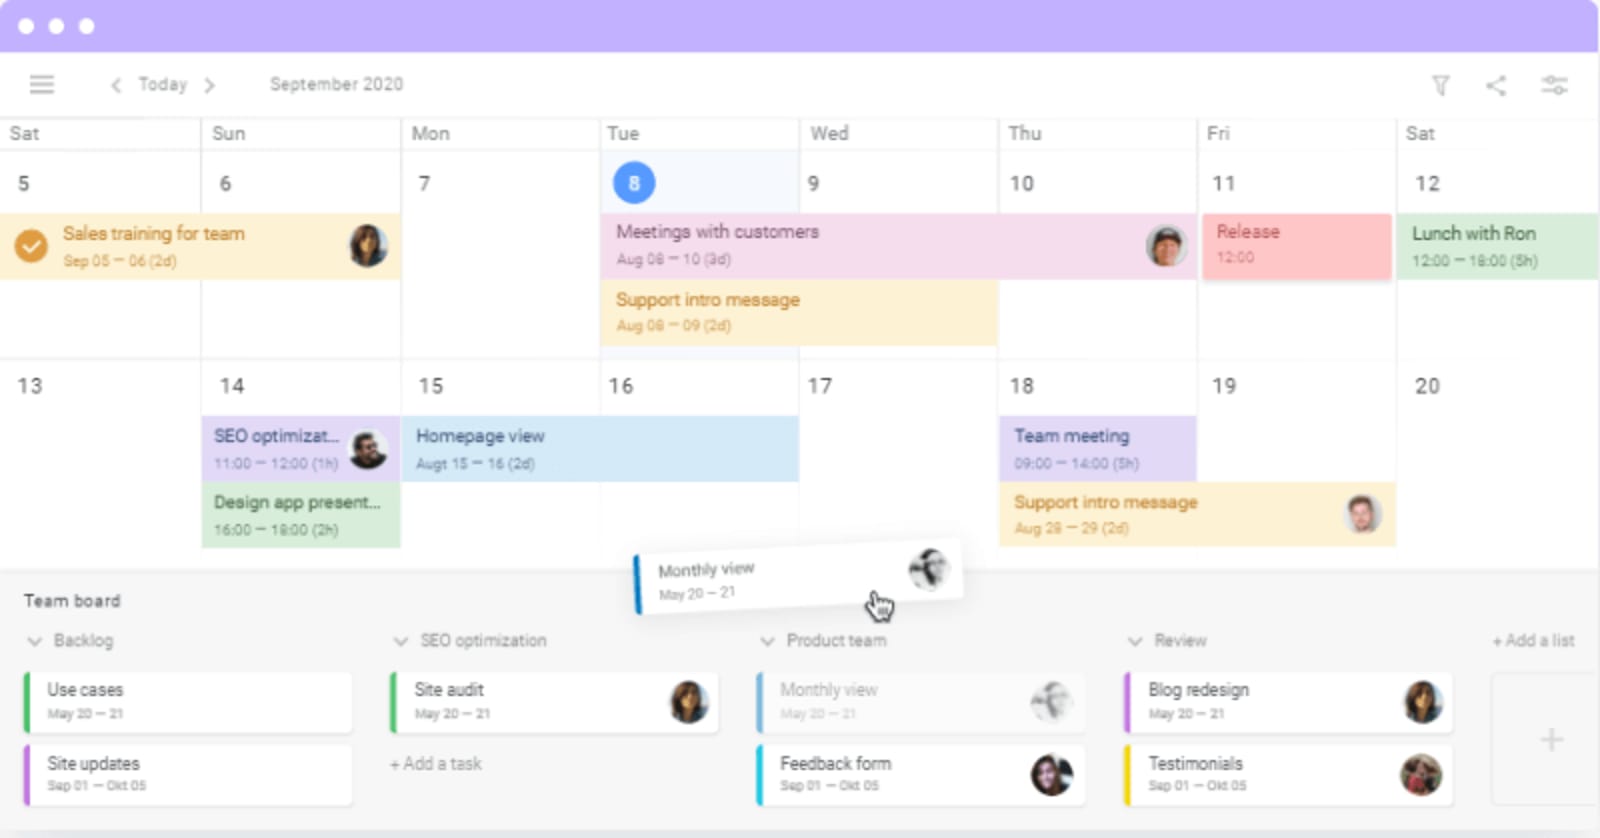
6. Planyway Team Planner
Planyway for Trello is useful in displaying the team calendar in daily, weekly, and monthly views. Trello cards are displayed in a timeline to allow users to manage their workflow and deadlines across boards. Users can create project plans using the Gantt-like charts feature of this application. Time tracking evaluates the team’s performance and control due dates for a project. External calendars can be synced with the boards using URL.
The multi-board feature of this app allows several boards for viewing in a single timeline. Users can create subtasks to plan and allocate checklist items and arrange on the calendar as separate cards.
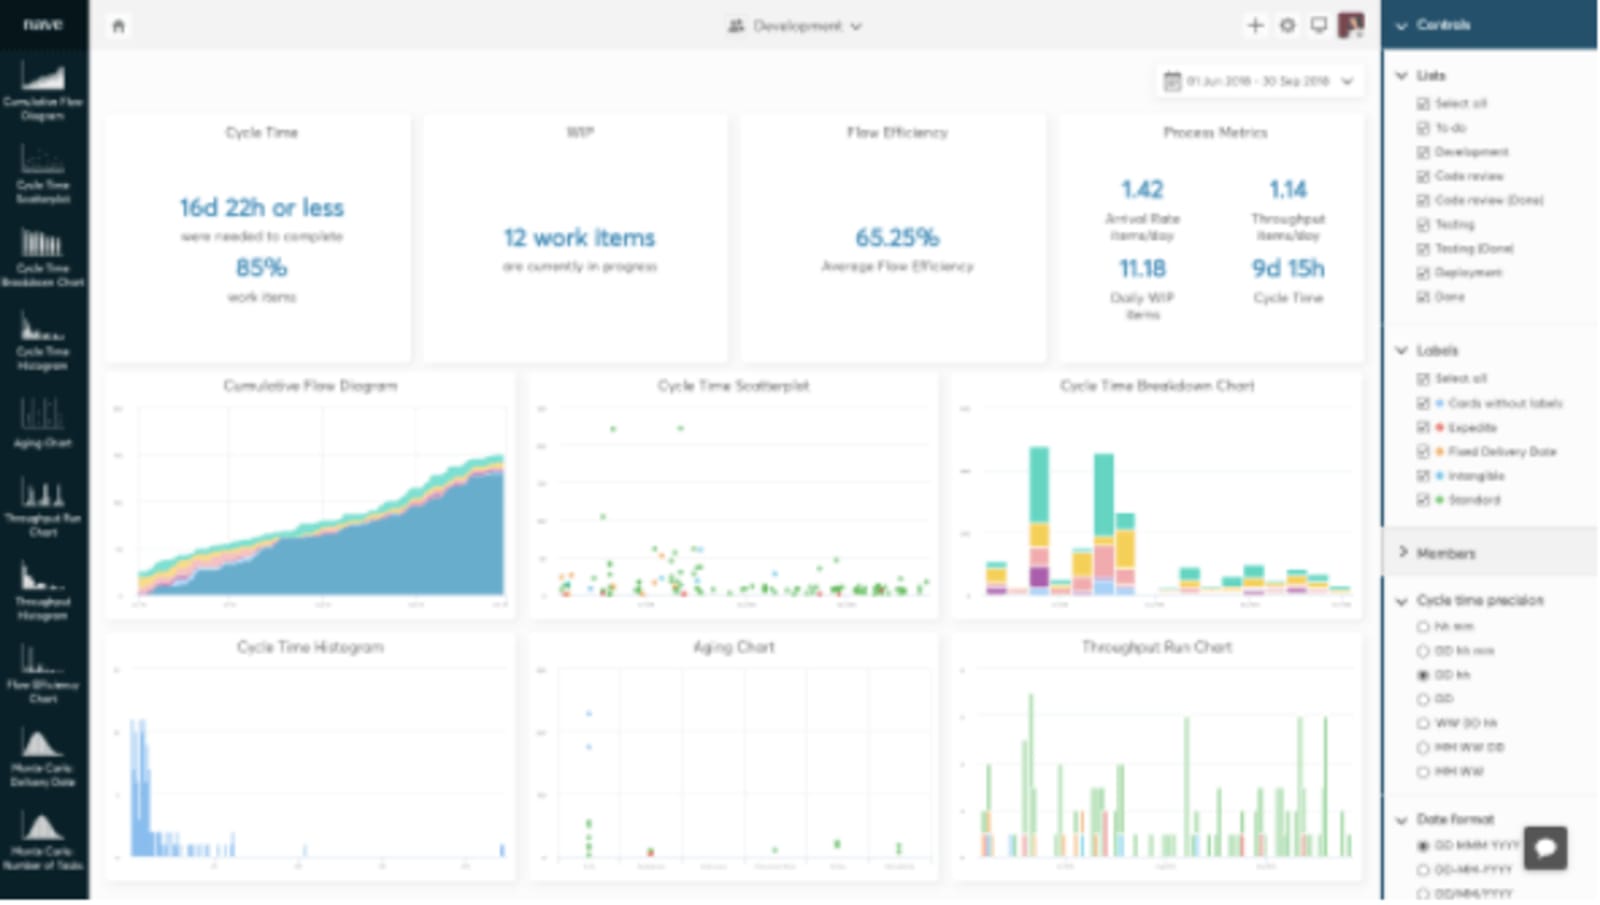
7. Kanban Analytics by Nave
Improved analytical charts were developed by Nave to provide a more effective method of evaluating teams’ performance and identifying common problems. This increases work efficiency. Users do real-time analysis of data for better and faster completion of tasks.
Using Kanban Analytics, users can view patterns in productivity and calculate the work delivery rate. Current tools include Cumulative Flow Diagram, Cycle Time Scatterplot, Breakdown Chart, and Histogram.
With the use of Kanban Analytics, users can forecast with increased precision, spot bottlenecks, and make decisions based on data analysis and interpretation.
Trello reporting is a great help for users working in a team, providing efficient monitoring and evaluation of the team’s performance and adherence to schedules. Various apps can be used as power-ups in Trello to help with this feature and simplify the analysis of data. The abovementioned apps are only some of the power-ups that can be used for Trello, depending on the purpose.
Delesign, which is trusted by businesses in growing their organization through high-quality designs, makes use of these applications for more efficient project management.

Maria is a Content Writer with keen interest in eCommerce and Internet Marketing. She is a Communications graduate and understands what it takes to write persuasive copy and blog posts. Outside of work, you can find her mini-blogging about her life on social media.